Memory consumption improvements
The linux perf framework is a great tool to analyze performance and memory consumption of applications. I've reduced the overall memory consumption in the last few days. Let me show you a small change that alone reduced the memory by 3MB when loading minecraft files.
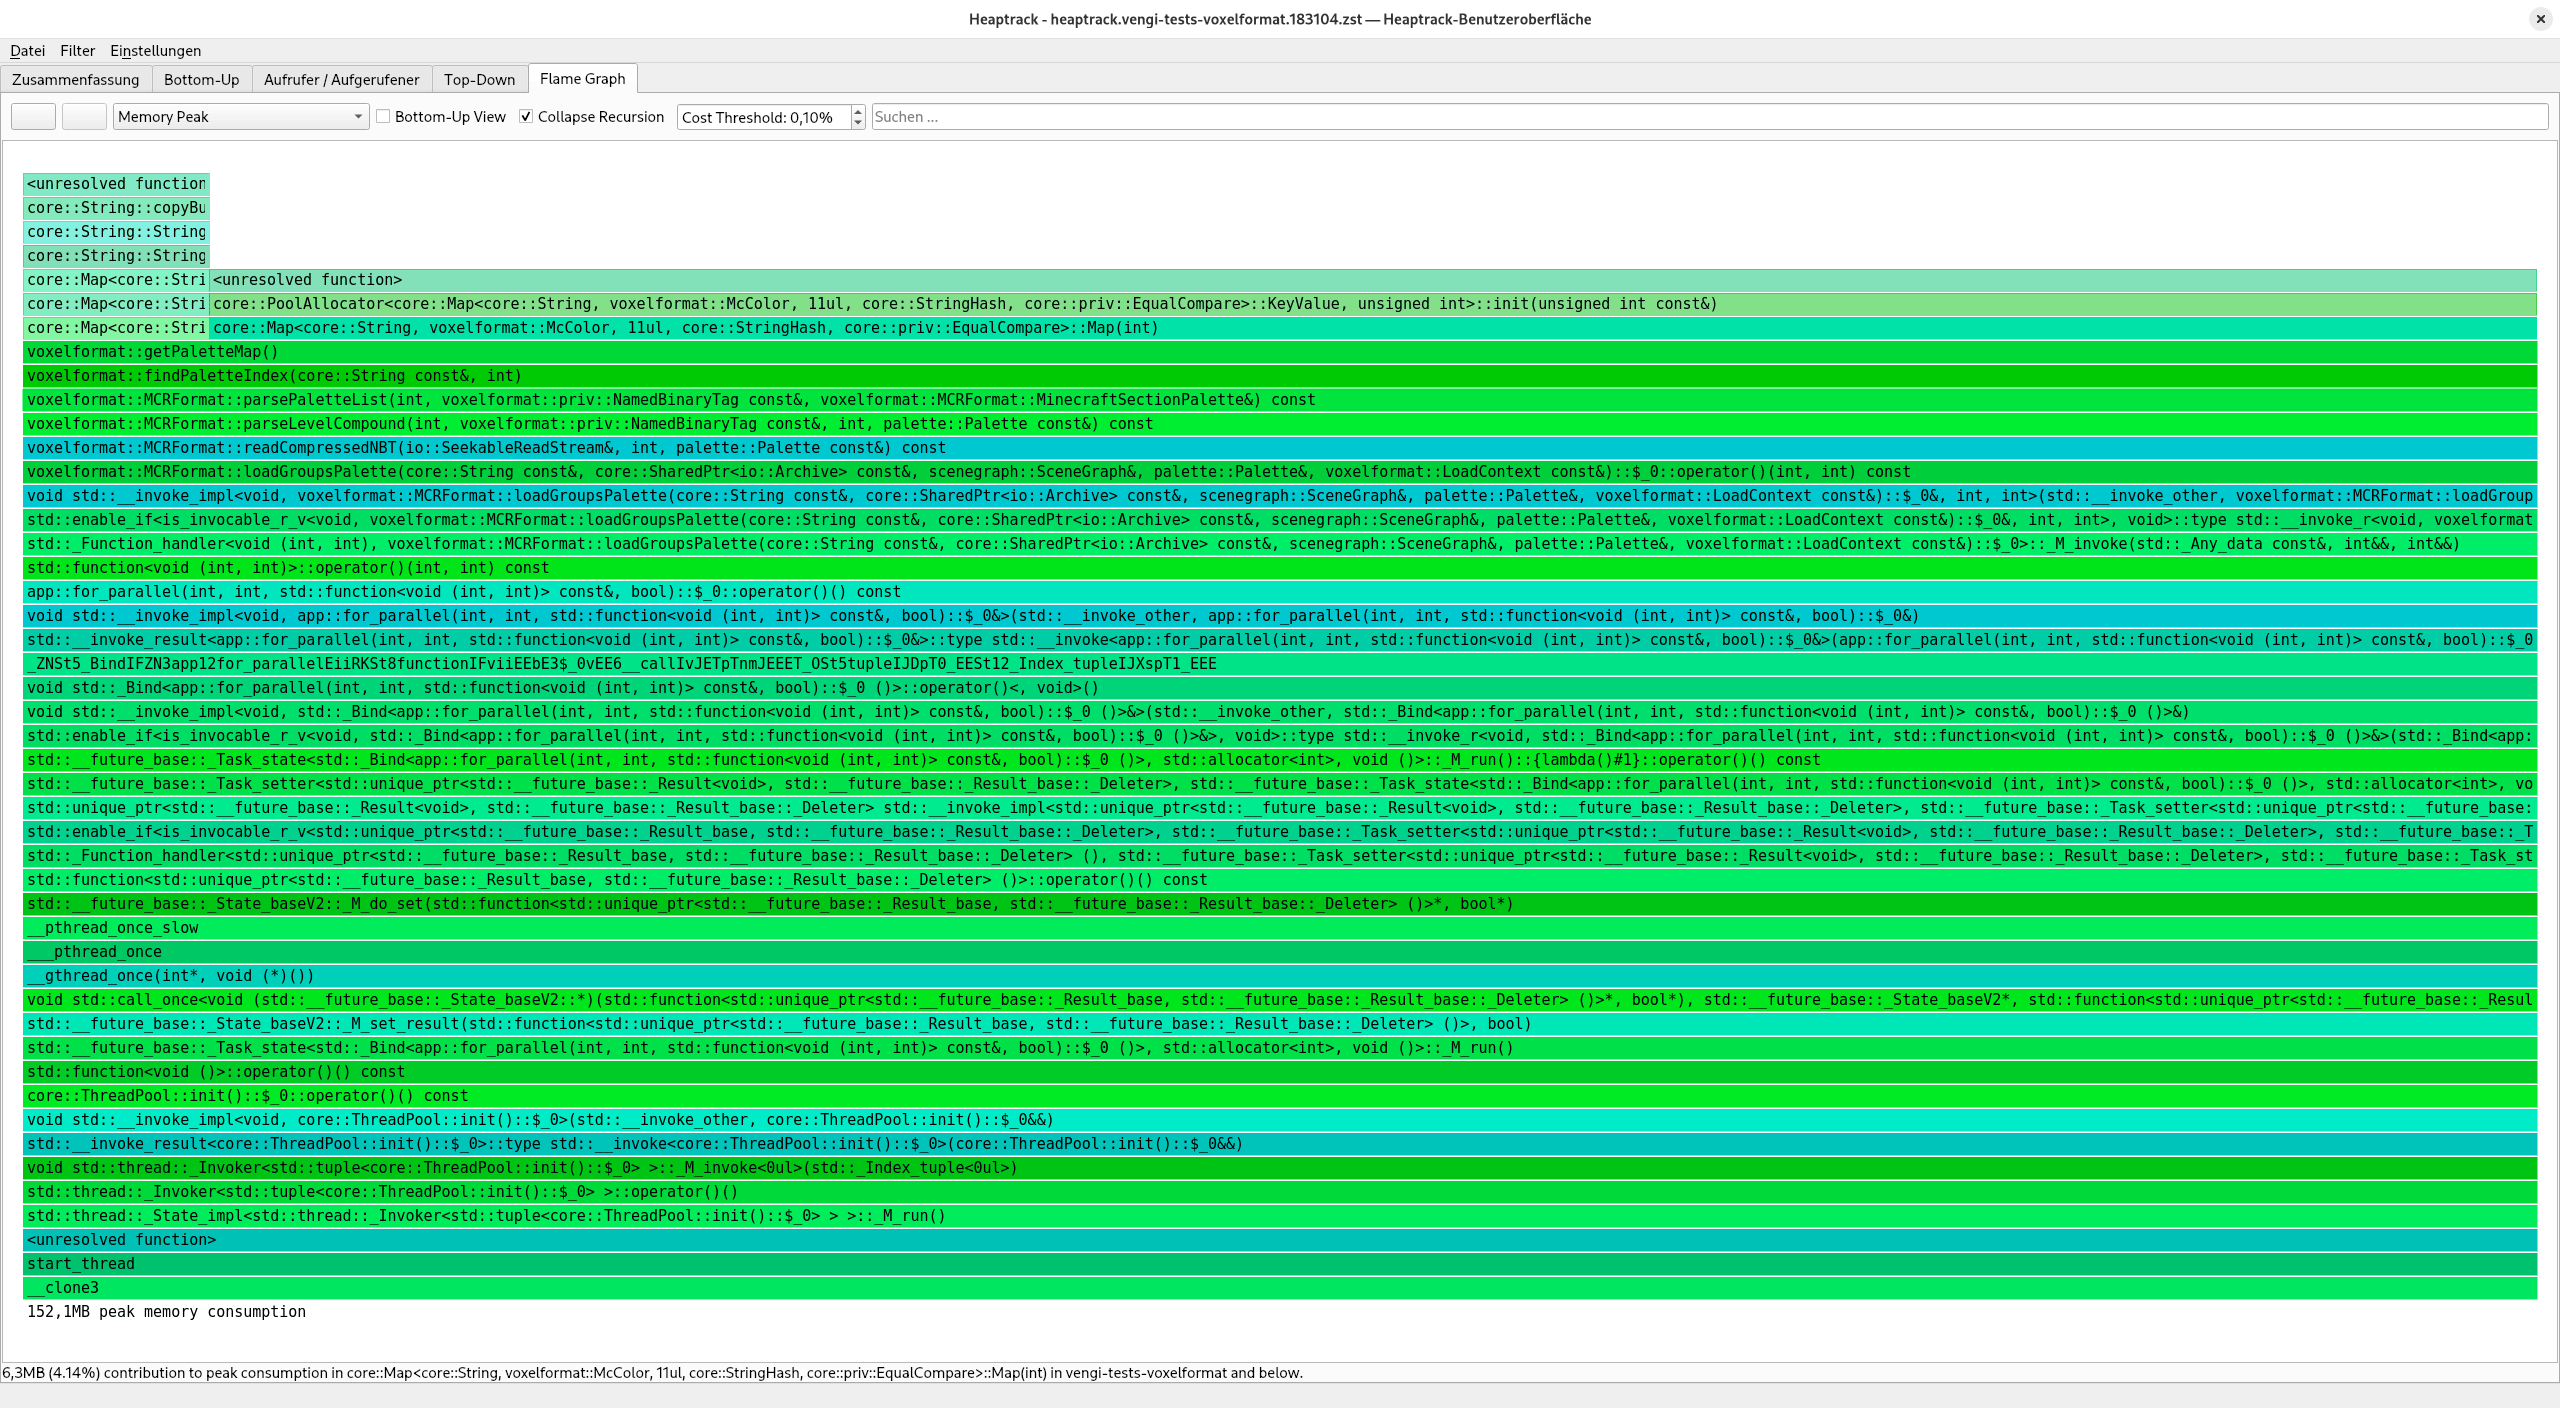
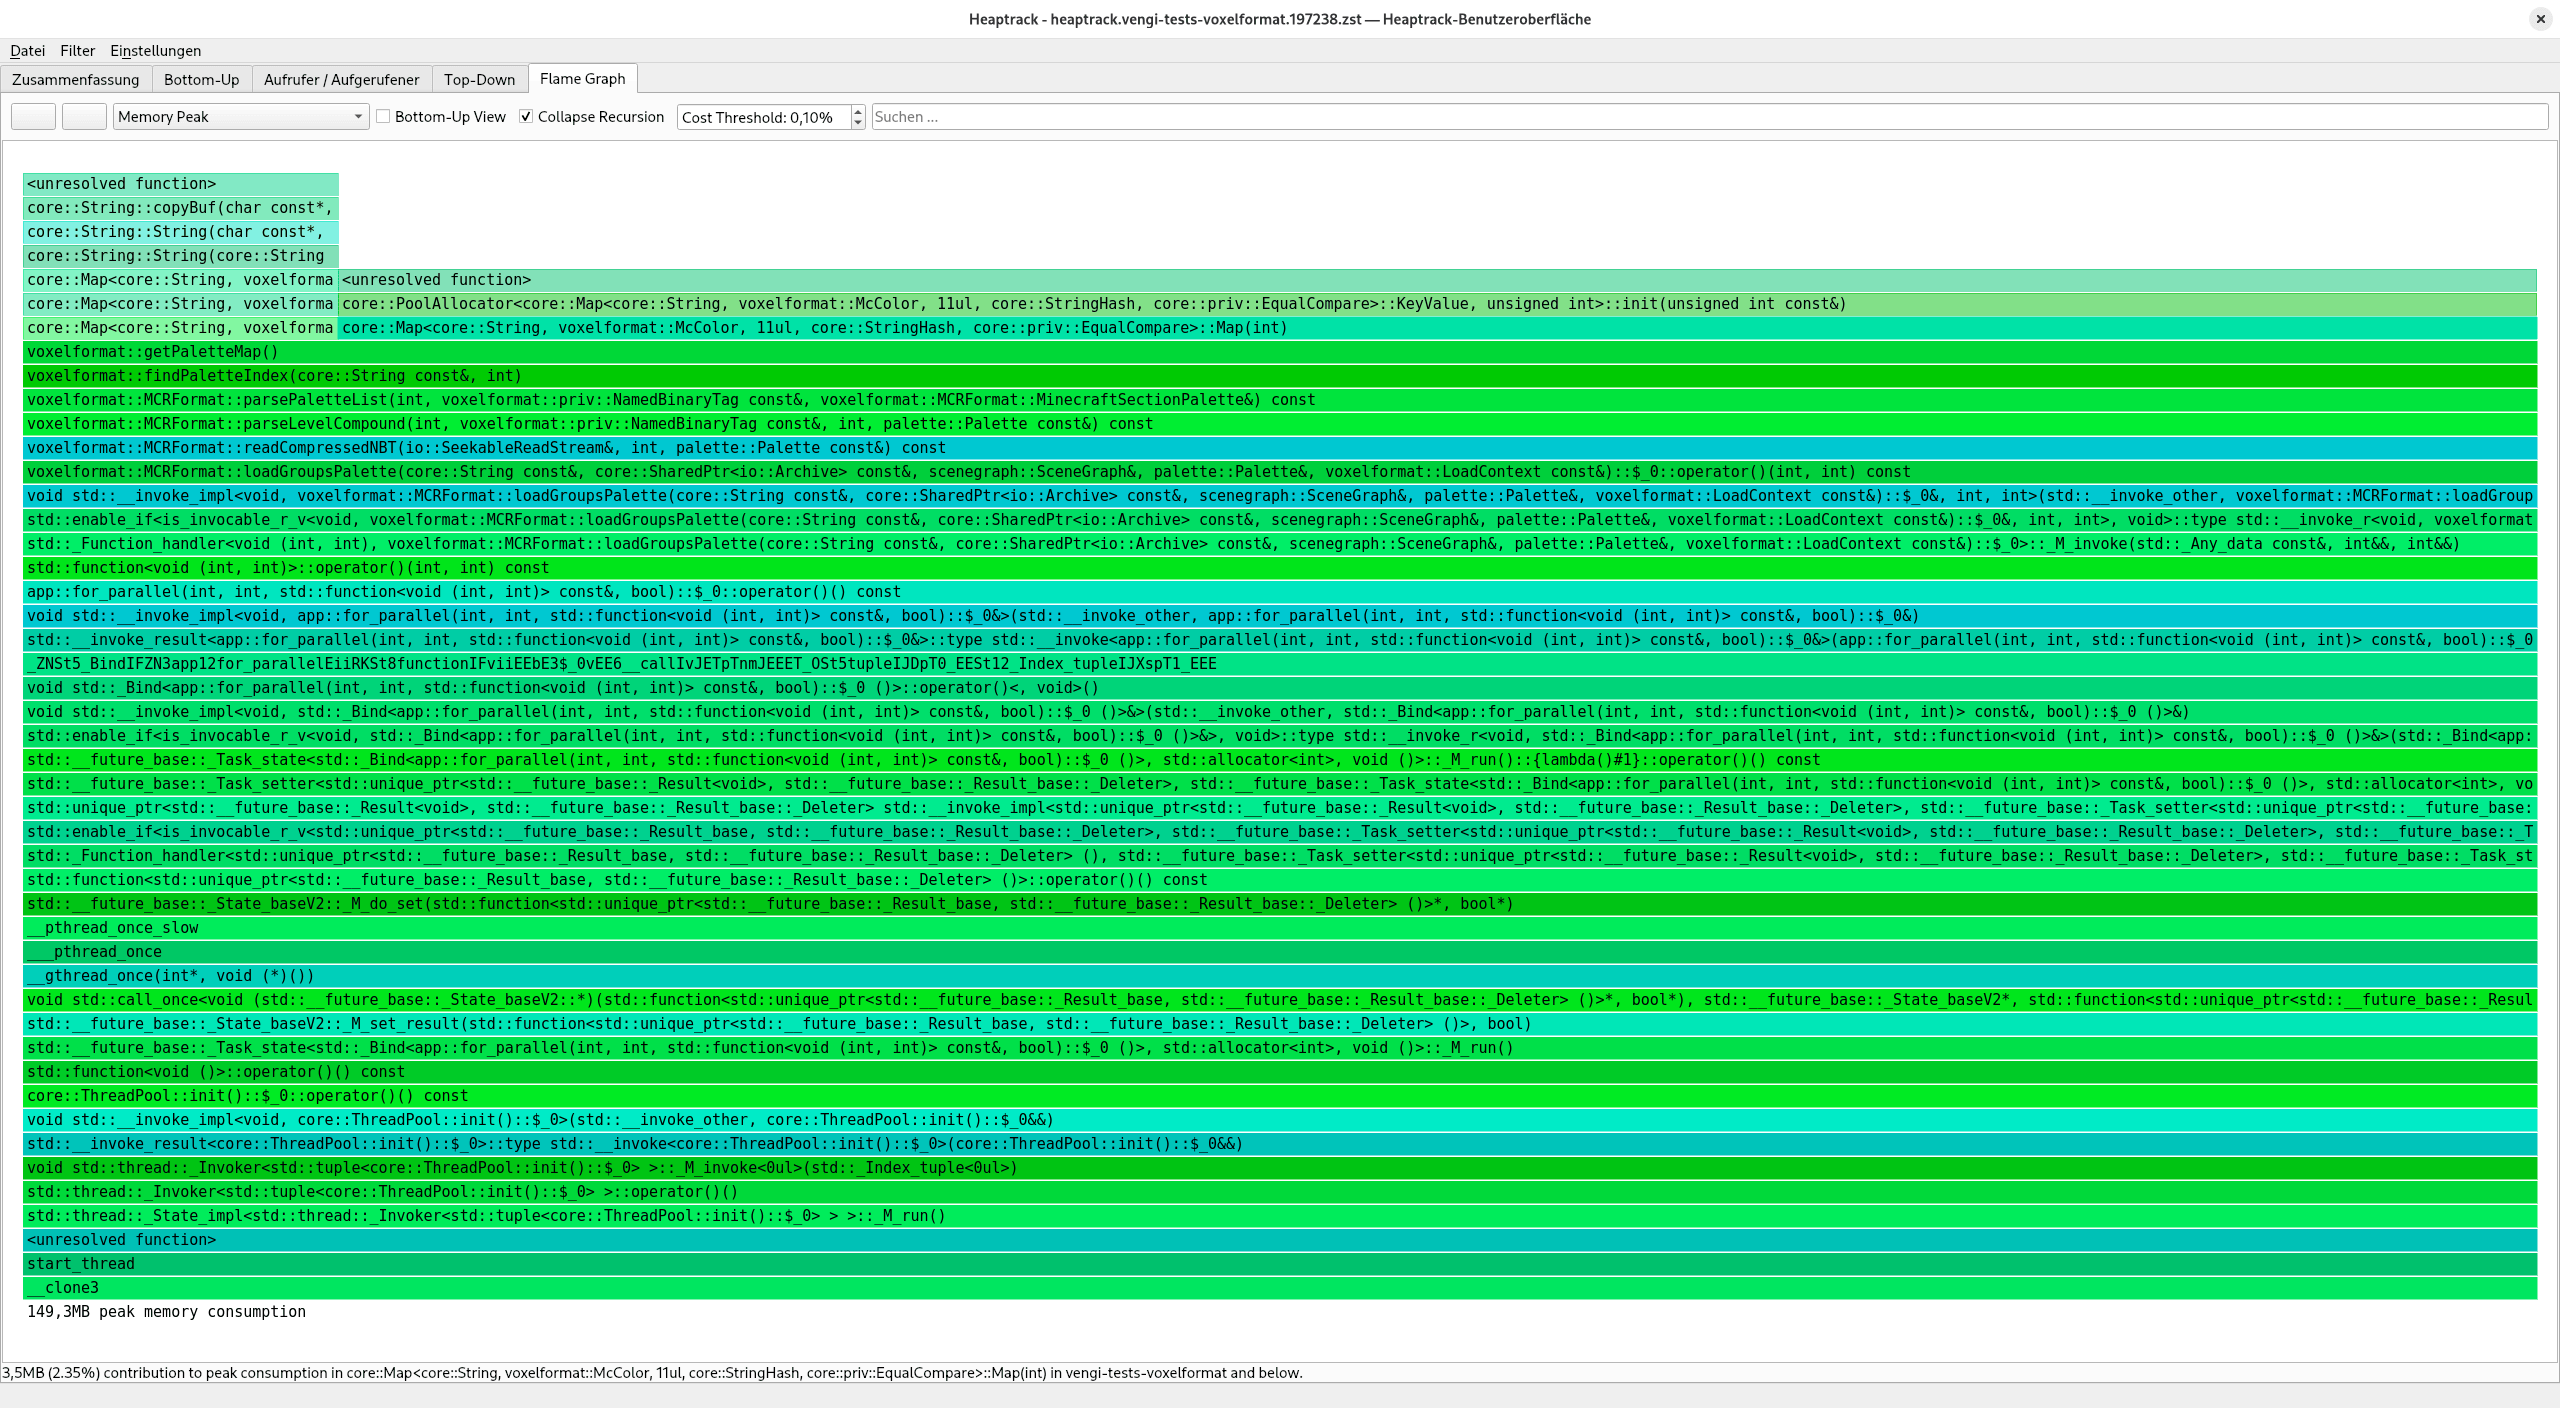
Notice the overall memory consumption of 152,1MB. The fixed size hash map implementation was just initialized with the wrong size and the pool allocator just allocated 3MB more than needed. After fixing this, the overall memory consumption is down to 149,3MB.
This is also integrated into the cmake and makefile build system. You can run make tests-voxelformat-heaptrack to generate a heaptrack file that can be analyzed with the heaptrack gui application.
A few of the collection classes also got chunk allocators as well as free lists to reduce the memory fragmentation and overhead while allocating and freeing memory.
Memory leaks
Two memory leaks were also fixed in the error handling code of the genland and the importAsPlane lua bindings. While investigating them I've also found that there were no unit tests for importAsPlane. This is now fixed, too and the scripting docs also got updated.
Google benchmark - hotspot
There are always two tools that I use to analyze performance, the google benchmark library and hotspot - a tool that also uses the linux perf framework, but provides a nice gui on top of it. The google benchmark library is great to measure small code snippets and compare different implementations. hotspot is more useful to analyze the overall application performance and find bottlenecks.
One of those bottlenecks was the PaletteLookup class that is used to find the closest matching color in a palette. This is used in multiple places, for example when voxelizing meshes or converting images to voxel data. The original implementation used a hash map to speed up repeating lookups. But this map couldn't get used in multiple threads. The current implementation uses a fixed size array - and is using quantization to perform O(1) lookups. This is a huge speedup, especially when voxelizing meshes with many different colors and using multiple threads.
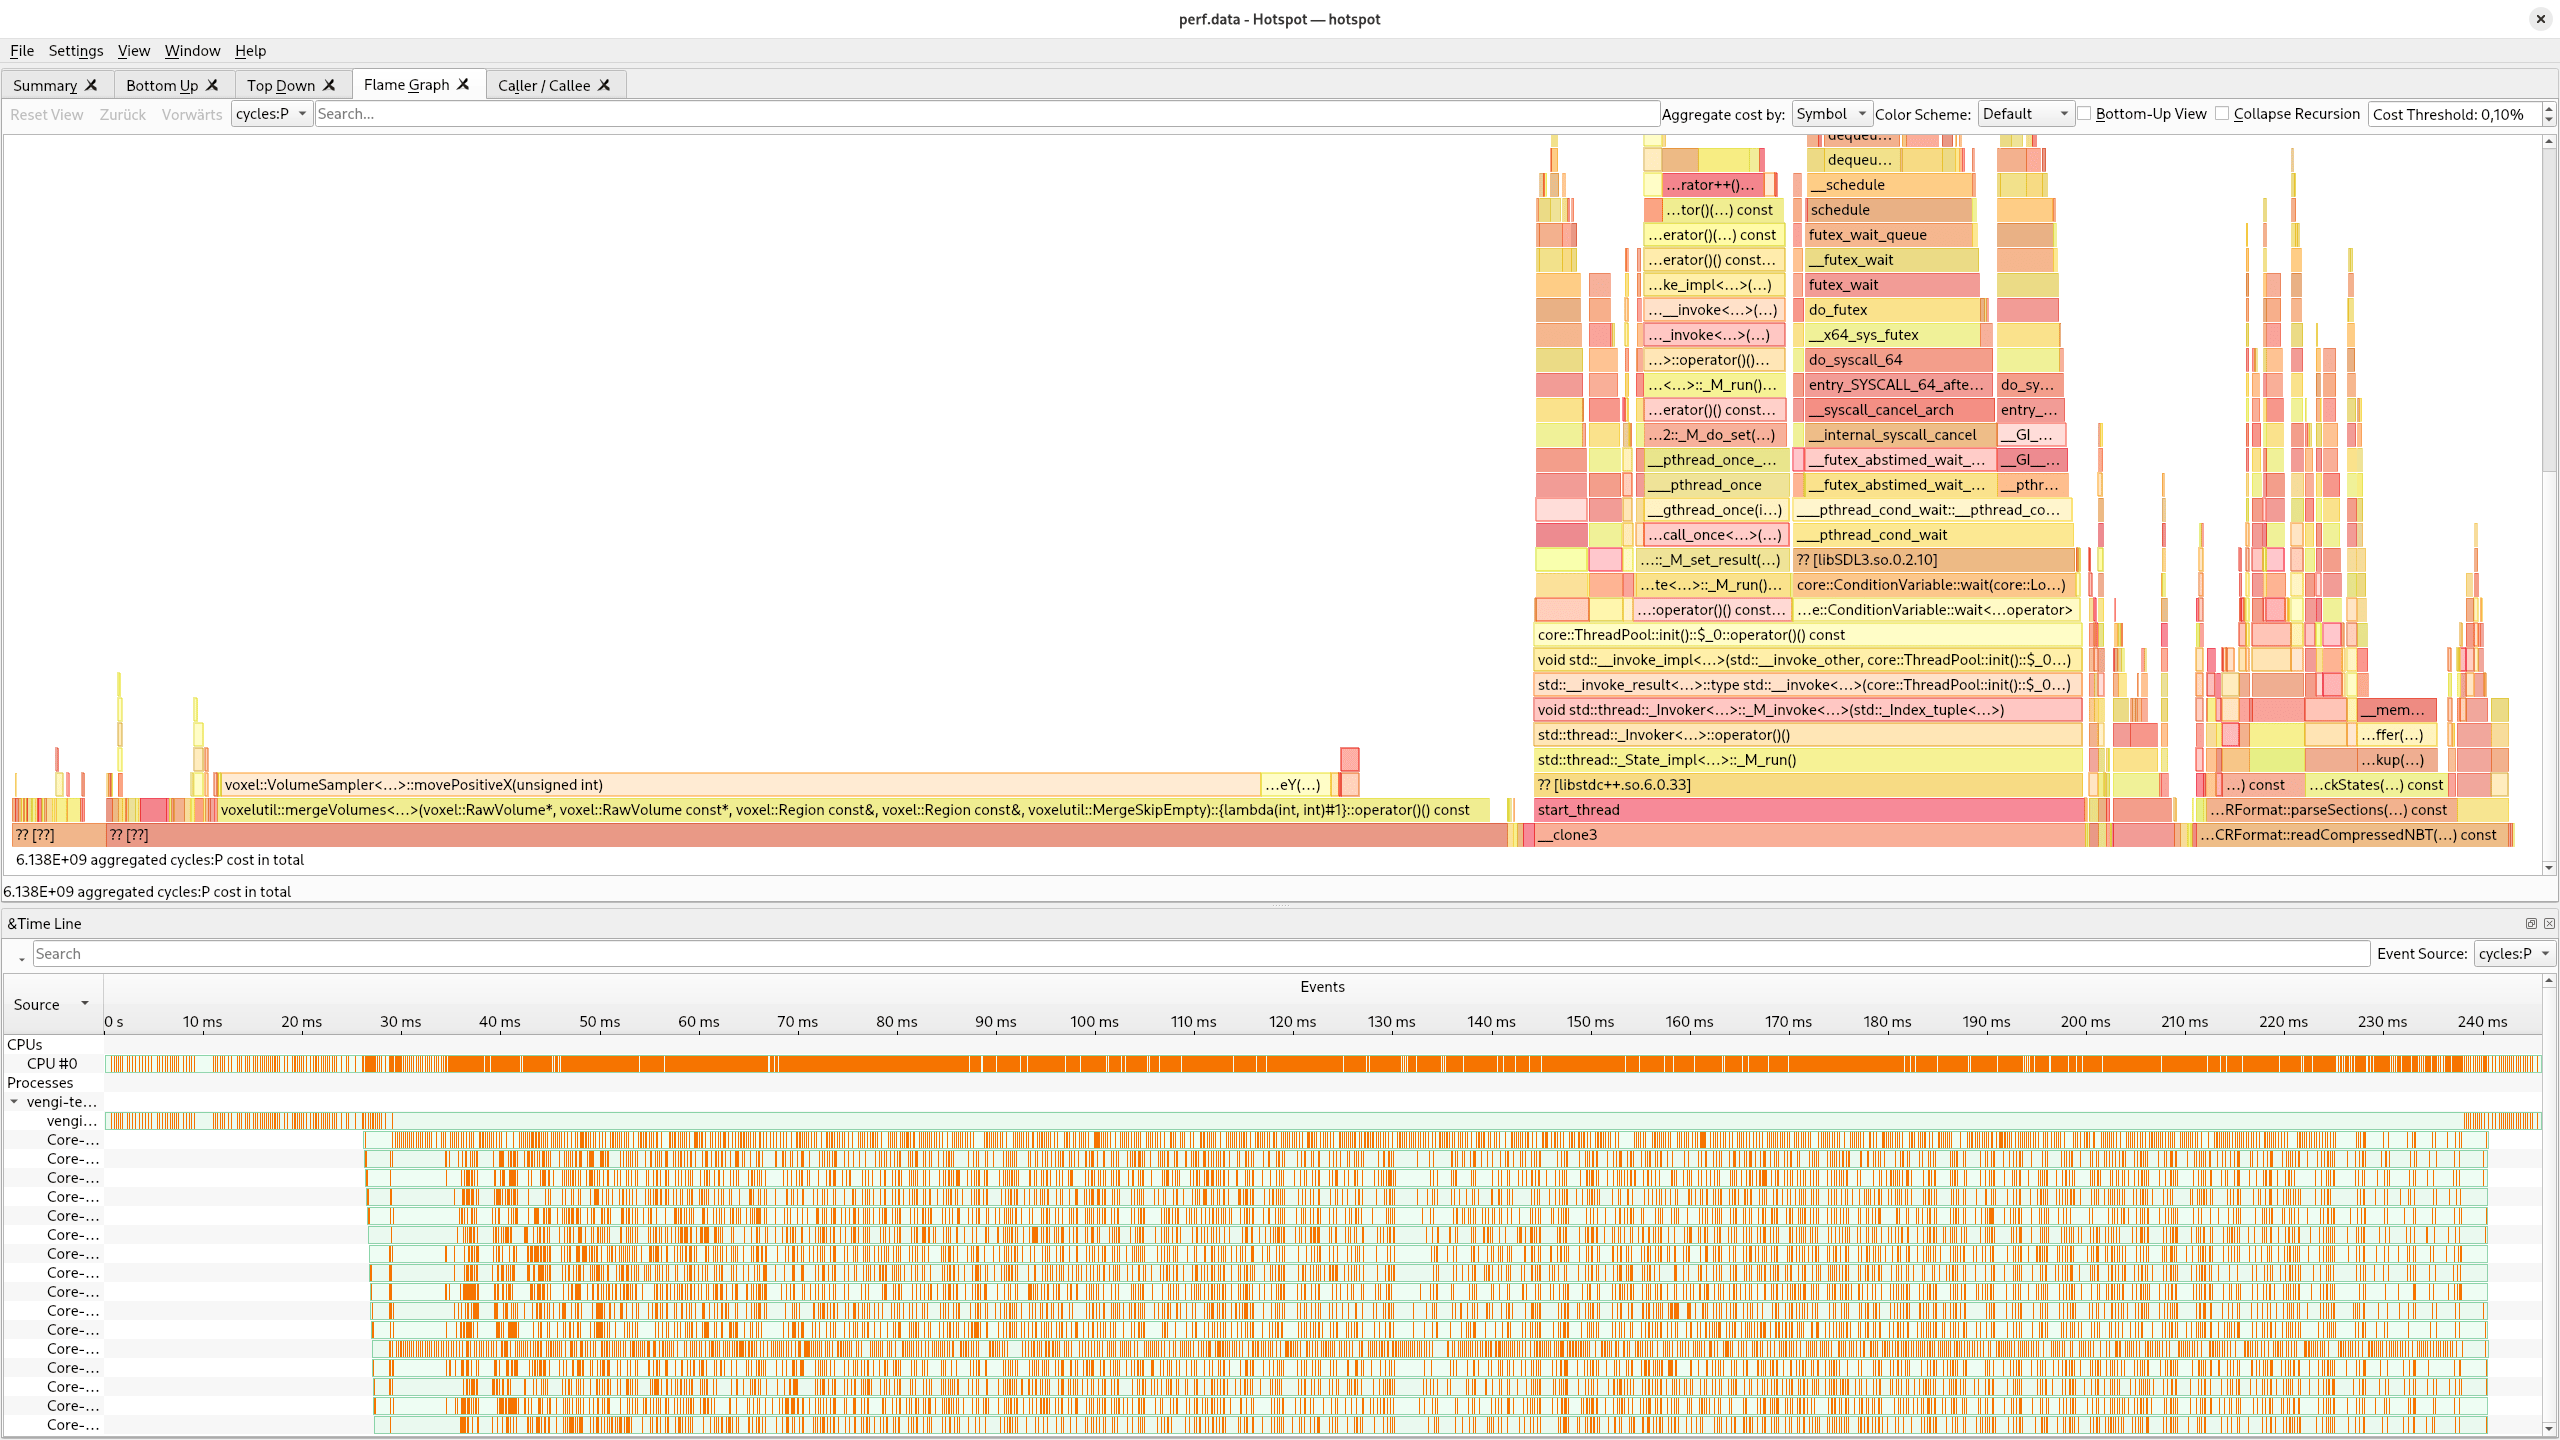
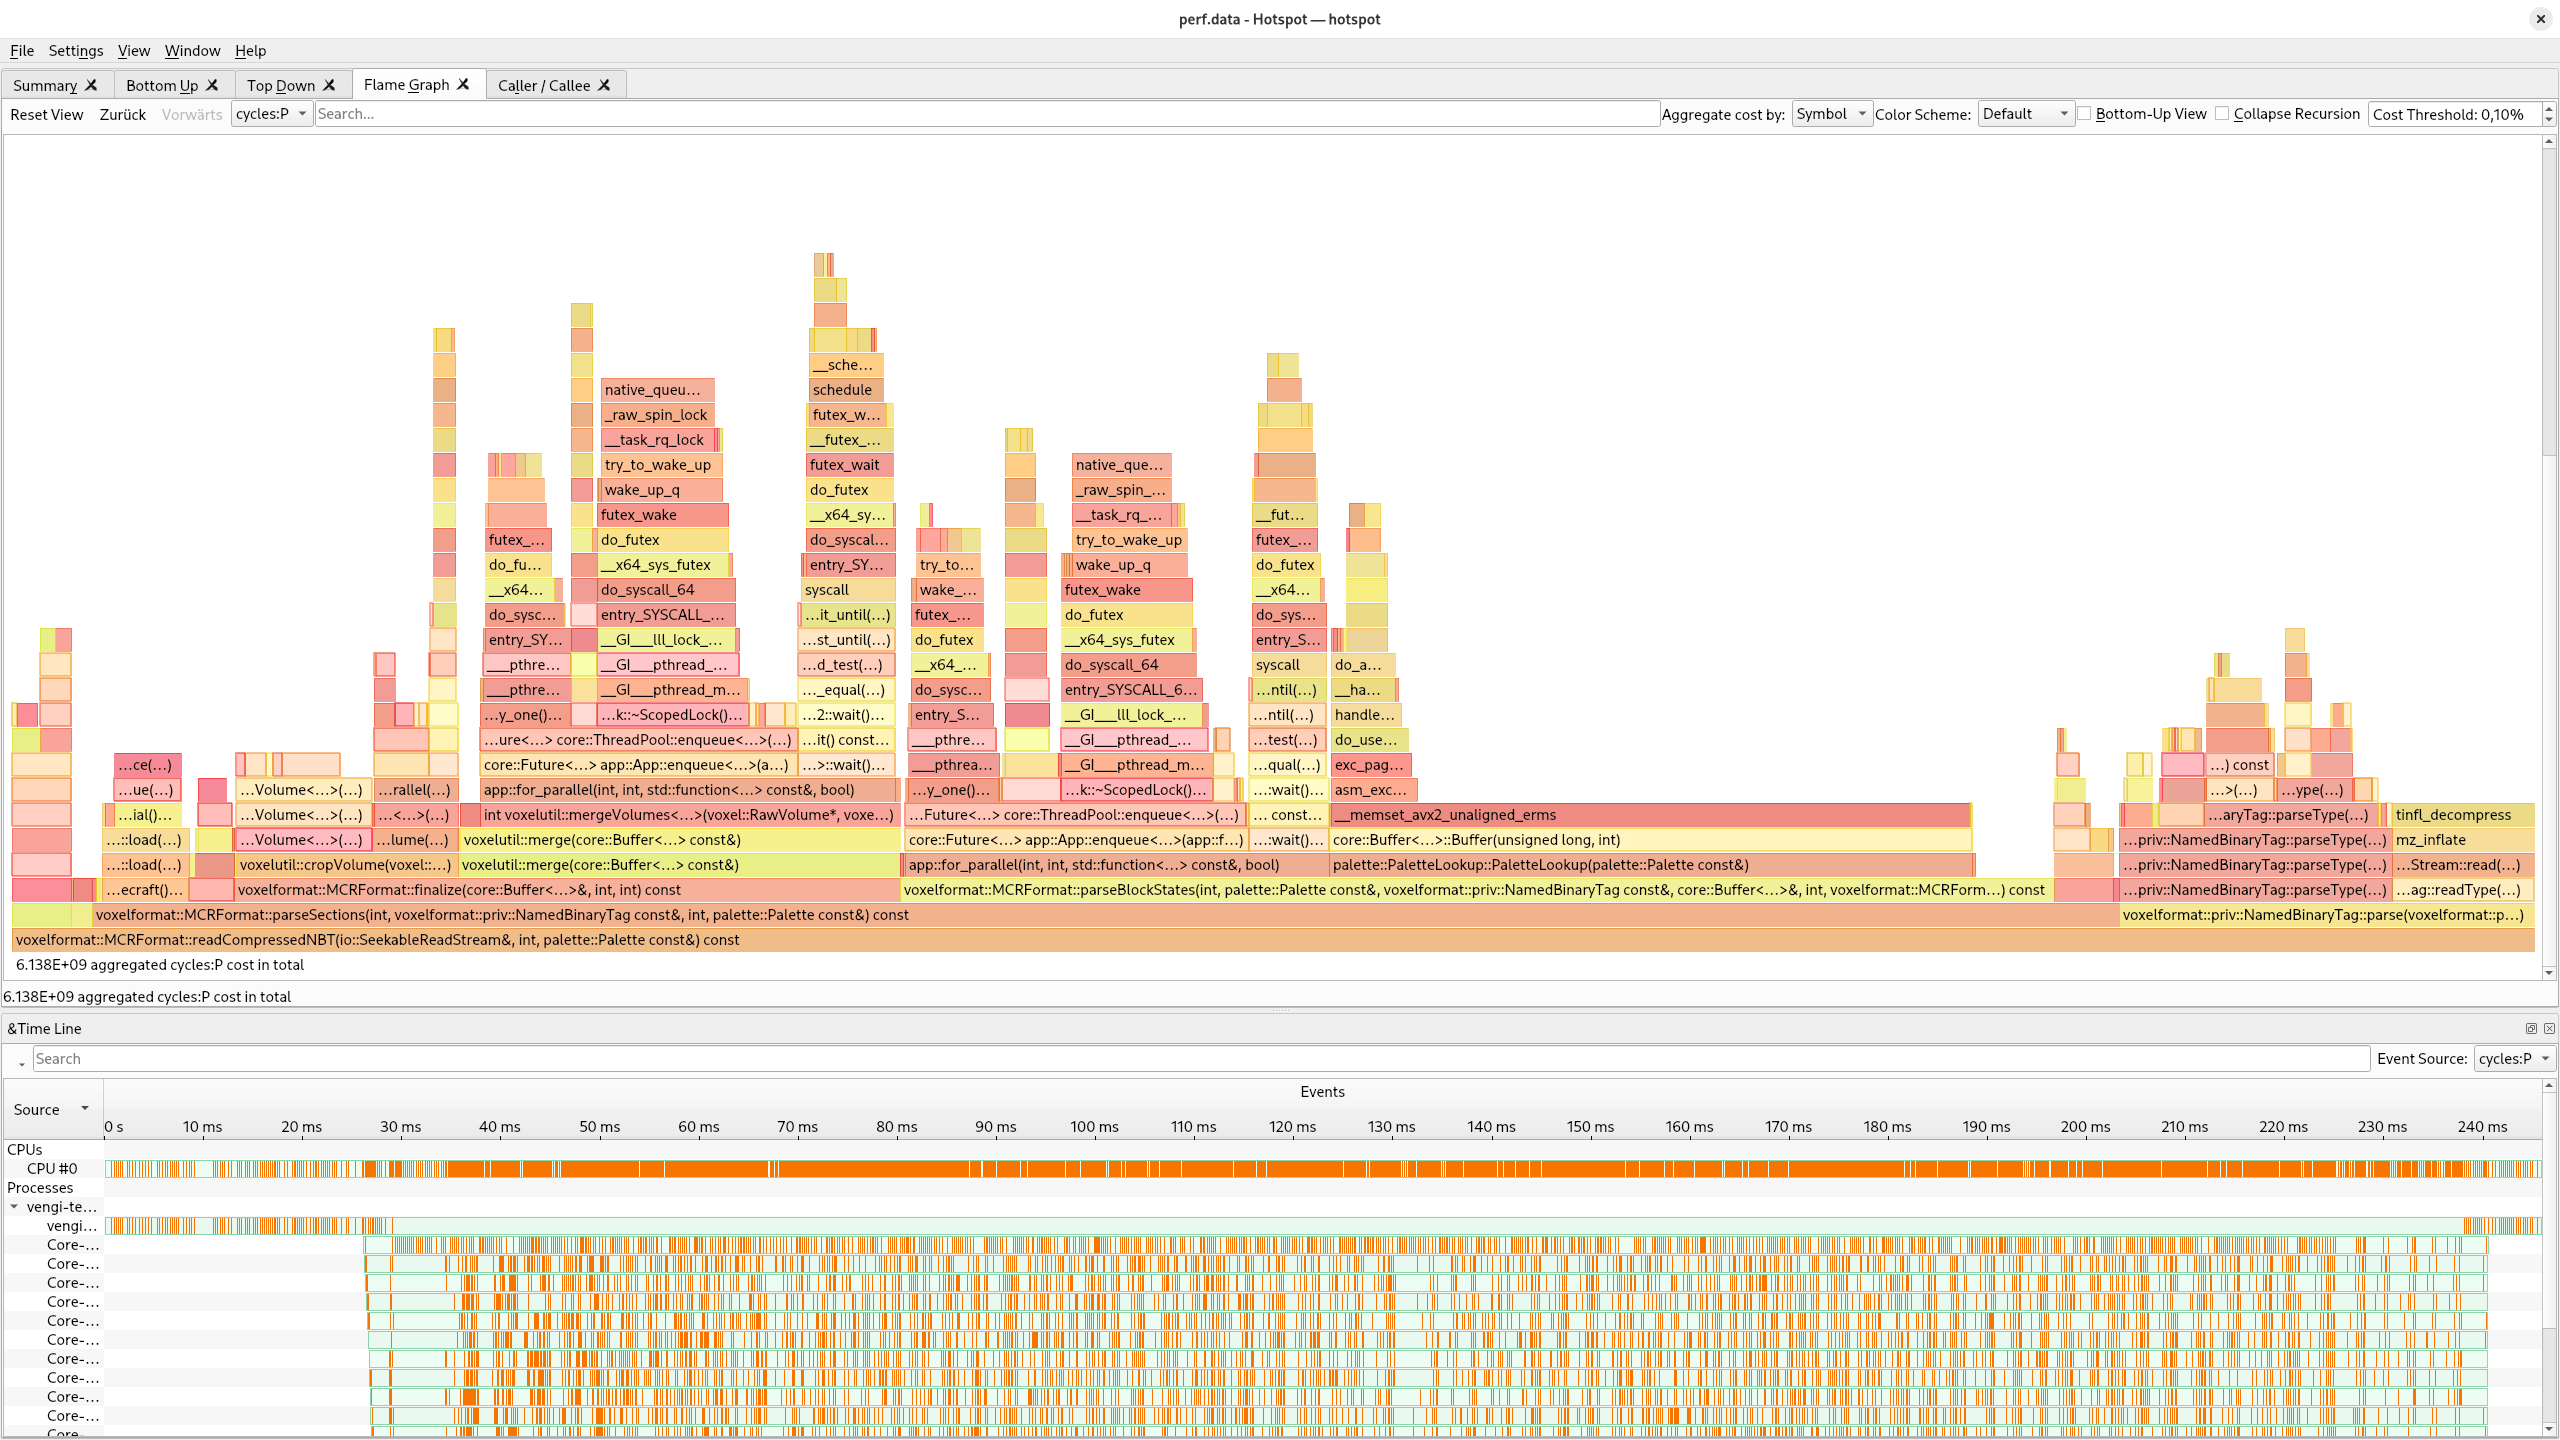
Before this change was made, the PaletteLookup dominated the cpu usage in my measurements. After the change, the PaletteLookup is not even visible anymore in the hotspot flame graph without zooming in (second screenshot).